
Why Is Your GPU Using More VRAM Than Expected?
Introduction
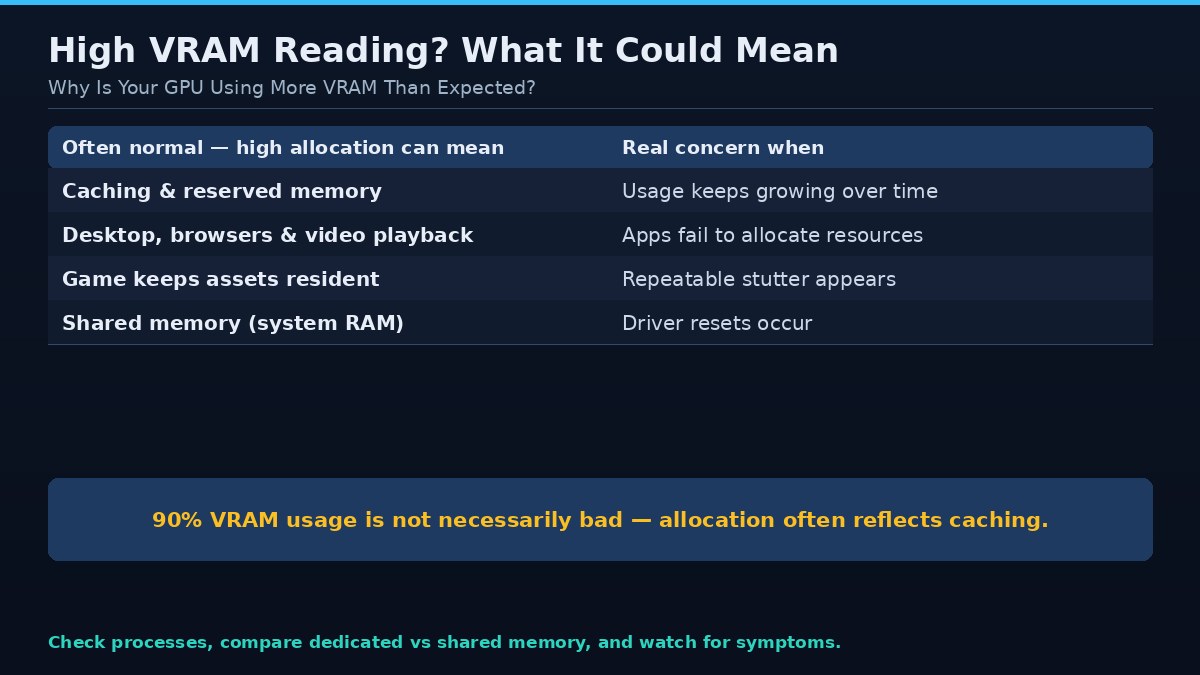
Seeing a large VRAM number in a monitoring tool can be alarming, especially when no demanding game or creative application appears to be running. In many cases, however, the number reflects memory reserved for caching, a desktop application using hardware acceleration, or the way a particular utility reports allocation. High usage deserves investigation when it is accompanied by errors, performance problems, or unexplained growth, but it is not automatically a fault.
A graphics memory problem should be diagnosed from evidence rather than guessed from one monitoring number. The operating system, driver, application, and monitoring utility may describe memory in different ways. Some tools show dedicated allocation, some show a process's usage, and others expose a budget or shared-memory value. Those figures can be useful, but they do not all mean that the GPU has run out of physical memory.
| Possible cause | What to check |
|---|---|
| Desktop composition and browsers | Close applications one at a time to identify the contribution |
| Game caching assets | High allocation can be normal if performance is stable |
| Shared GPU memory | Check dedicated and shared GPU memory metrics separately — do not confuse them |
| Background apps and overlays | Exit unnecessary applications and check the process list |
Quick answer
Check which processes are using the GPU, compare dedicated and shared memory metrics, and observe whether usage changes during a repeatable workload. Distinguish reserved or allocated memory from a genuine shortage.
Understand the symptom before changing settings
Write down what happens, when it happens, and whether it can be reproduced. Does the problem occur at startup, when loading a level, after several minutes, when opening a large project, or only at a particular setting? Does the application close, display an error, freeze, or continue with reduced performance? The timing often narrows the possible causes.
Record the exact GPU, driver, application version, operating system, system RAM, and workload settings. If the problem began after an update, note that date and version. Keep a copy of any error message. Avoid changing several driver and registry settings at once, because doing so makes it difficult to identify the cause and may create a second problem.
Allocation versus active demand
An application may reserve memory so that resources are available quickly later. A driver can also manage a memory budget that differs from the amount physically installed. As a result, an allocation reading may be high even when the current scene does not actively use every byte. Monitoring tools expose different metrics, so compare their labels and documentation.
Desktop composition and browsers
The Windows desktop compositor, browsers, video playback, and applications with hardware acceleration can use GPU resources. Multiple browser tabs, video streams, animated pages, and graphics-heavy web apps can increase activity. Close applications one at a time to identify whether they contribute to the reading.
Games and caching
Some games retain recently used assets in memory to reduce loading delays. A game may use more memory when it has access to a larger pool, without requiring all of it to render the current frame. A high allocation can be normal if performance remains stable and the game does not show memory-related symptoms.
Shared GPU memory is different
Windows can expose shared GPU memory, which is system RAM available for certain GPU operations. It should not be confused with dedicated VRAM physically installed on a graphics card. Shared memory has different performance characteristics and is not an equivalent upgrade. Check the separate metrics before interpreting a combined usage figure.
Background applications and overlays
Recording software, streaming tools, RGB utilities, game overlays, monitoring dashboards, and creative applications can keep GPU resources active. Some tools use only small amounts, while others may create larger allocations depending on settings. Exit unnecessary applications and check the process list to understand their contribution.
When high usage is a real concern
Investigate if memory usage continually grows, applications fail to allocate resources, games show repeatable stutter, or the driver resets. Check for memory leaks, application bugs, and driver issues. Restart the affected application and compare the result after an update or clean configuration.
How to measure correctly
Record idle usage after a fresh restart, then open one application at a time. Note process-level usage, dedicated memory, shared memory, and GPU engine activity. Repeat the same sequence after closing the application. This controlled method is more informative than comparing one number with an arbitrary online screenshot.
Safe troubleshooting sequence
Begin with reversible application-level changes. Save work, close unnecessary GPU-accelerated applications, and restart the affected program. Check whether an official update addresses the issue. If you change a graphics option, record the original value and test one option at a time. If the application offers a lower-memory mode, smaller texture setting, reduced batch size, or project optimization option, use the documented control rather than an unofficial patch.
Next, inspect system conditions. Check GPU temperature, power behavior, system memory pressure, storage availability, and background processes. A system can appear to have a VRAM problem when the actual cause is a driver reset, overheating, unstable overclock, insufficient system RAM, or a damaged application cache. Restore factory GPU clocks if the card is overclocked and test stability before making further changes.
If the problem persists, collect logs and reproduce it with the smallest possible workload. Compare a new project or clean game profile with the original one. If the clean workload works, the issue may relate to a particular asset, configuration, plugin, or save. If all workloads fail, investigate the driver, operating system, and hardware more broadly. Use official support channels for driver cleanup or firmware procedures.
What not to do
Do not download unknown executables advertised as VRAM expanders, memory cleaners, or guaranteed stutter fixes. Software cannot increase the physical dedicated memory installed on a discrete GPU. Avoid registry edits copied without a clear explanation, disabling security services, or flashing unofficial firmware. These steps can destabilize a system and make diagnosis harder.
Do not assume that a higher memory allocation is itself a fault. Some applications reserve memory for caching. Do not publish a benchmark claim from a single run or infer a hardware defect from one crash. Verify the issue, preserve logs, and distinguish observed facts from possible explanations.
Frequently asked questions
Is 90 percent VRAM usage bad?
Not necessarily. Allocation may reflect caching. It becomes concerning when accompanied by failures, performance problems, or evidence that the workload cannot obtain needed resources.
Why does my GPU use VRAM on the desktop?
Desktop composition, browsers, video playback, and hardware-accelerated applications can use graphics memory.
Can games use all available VRAM?
Some games allocate or cache resources based on the available budget. High allocation does not always mean every byte is required.
Does shared GPU memory mean my VRAM is full?
Not by itself. Shared memory is a separate system-memory resource. Interpret it alongside dedicated memory and application behavior.
Should I use a VRAM cleaner?
Avoid utilities that promise to free memory automatically. Close the application holding the resources or restart it if necessary.
Conclusion
Look at process activity and actual symptoms before treating a high VRAM reading as a problem. Allocation alone is not proof of a memory bottleneck.
A methodical approach is safer and more effective than applying a collection of unrelated tweaks. Identify the symptom, capture the configuration, change one variable at a time, and confirm that the result is repeatable. If the issue appears to be hardware-related or involves repeated driver resets, use manufacturer diagnostics or qualified repair support rather than risking the system with undocumented fixes.