
How to Monitor VRAM Usage While Gaming
Introduction
Monitoring VRAM while gaming can help explain texture streaming, memory allocation, and performance changes. It is especially useful when comparing graphics settings or investigating stutter. However, an overlay is only as useful as the metric it displays. Different tools may report dedicated memory, shared memory, process allocation, total committed memory, or a budget. Understanding those labels is essential before drawing conclusions.
A graphics memory problem should be diagnosed from evidence rather than guessed from one monitoring number. The operating system, driver, application, and monitoring utility may describe memory in different ways. Some tools show dedicated allocation, some show a process's usage, and others expose a budget or shared-memory value. Those figures can be useful, but they do not all mean that the GPU has run out of physical memory.
| Tool | What it shows | Article’s caution |
|---|---|---|
| Windows Task Manager | Dedicated and shared GPU memory in the Performance tab | Useful as a first check rather than a complete diagnostic profiler |
| Third-party overlays | GPU temperature, clock speeds, utilization, memory use, and frame rates | Verify the displayed memory metric is the one you intend to track |
| Frame-time capture | Average FPS, frame-time traces, and a low-percentile metric | VRAM alone does not tell whether a game is smooth |
Quick answer
Use a trusted monitoring utility or Windows performance view, record dedicated and shared memory separately, and capture frame-time behavior alongside VRAM. Compare the same game scene and settings across repeated runs.
Understand the symptom before changing settings
Write down what happens, when it happens, and whether it can be reproduced. Does the problem occur at startup, when loading a level, after several minutes, when opening a large project, or only at a particular setting? Does the application close, display an error, freeze, or continue with reduced performance? The timing often narrows the possible causes.
Record the exact GPU, driver, application version, operating system, system RAM, and workload settings. If the problem began after an update, note that date and version. Keep a copy of any error message. Avoid changing several driver and registry settings at once, because doing so makes it difficult to identify the cause and may create a second problem.
Understand the metrics
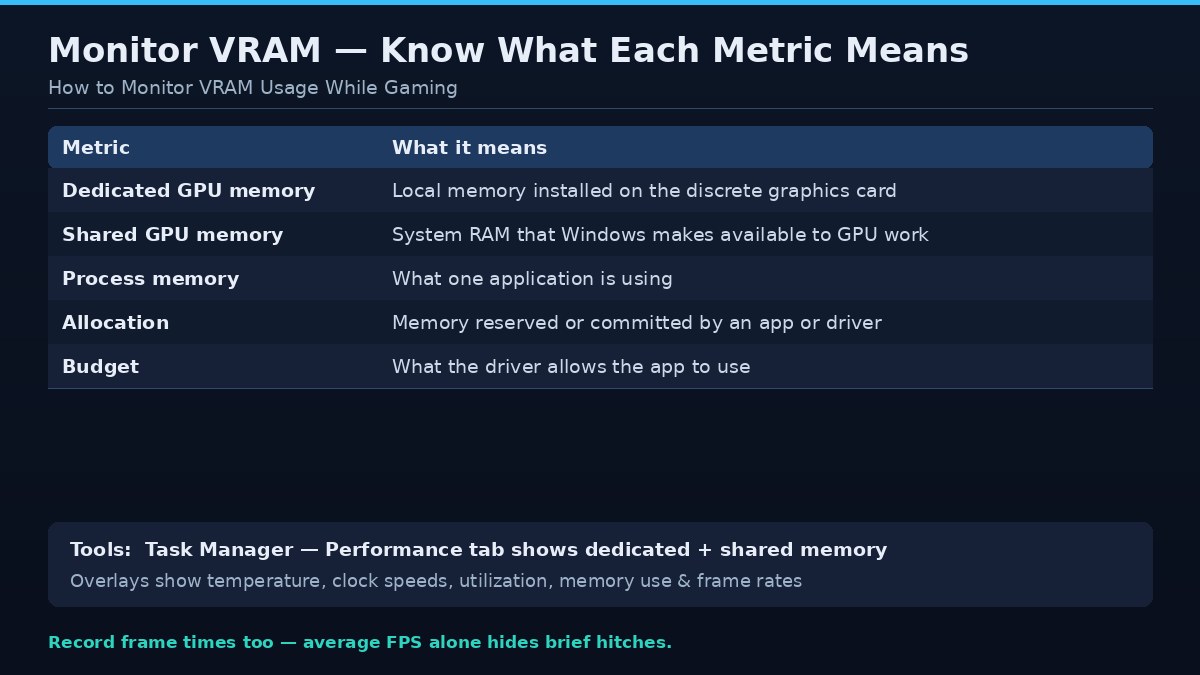
Dedicated GPU memory is the local memory installed on a discrete graphics card. Shared GPU memory refers to system RAM that Windows can make available to GPU workloads. Process memory, allocation, budget, and usage are different concepts. Read the tool's documentation so that you know whether it reports current use, reserved space, or a maximum budget.
Windows Task Manager
Task Manager provides a built-in overview of GPU activity and memory. The Performance tab can show dedicated and shared GPU memory, while the Processes view can help identify applications using GPU resources. Names and layout can vary by Windows release and driver. Treat the display as a useful first check rather than a complete diagnostic profiler.
Third-party overlays
Popular monitoring utilities can display GPU temperature, clock speeds, utilization, memory use, and frame rates. Choose reputable software from its official source and enable only the sensors you need. Too many overlays can clutter the screen or add their own overhead. Verify that the displayed memory metric is the one you intend to track.
Capture frame times as well
VRAM alone does not tell whether a game is smooth. Record average FPS and frame-time traces, and use a clearly defined low-percentile metric when comparing runs. A high memory allocation with stable frame times may be normal. A repeated hitch at the same scene transition deserves investigation, but it may be caused by CPU, storage, shader compilation, or streaming.
Build a repeatable test route
Choose a built-in benchmark or a route that can be repeated. Keep the game version, driver, resolution, texture quality, ray tracing, upscaling, and background applications consistent. Allow the game to compile shaders and load assets before capture. Run the route several times and compare the results rather than trusting one pass.
Avoid misleading comparisons
Different monitoring tools may poll sensors at different intervals and report different memory categories. A screenshot taken at a menu cannot be compared directly with one taken during a busy scene. Some games reserve memory gradually, and some release it only after leaving a level. Document the scene and test duration.
Use monitoring to make decisions
If memory use rises with texture quality and performance becomes inconsistent, test a lower texture setting. If usage is high but the game runs smoothly, there may be no reason to change anything. If another process consumes memory, close it and retest. Monitoring should guide a controlled experiment, not encourage random tweaking.
Safe troubleshooting sequence
Begin with reversible application-level changes. Save work, close unnecessary GPU-accelerated applications, and restart the affected program. Check whether an official update addresses the issue. If you change a graphics option, record the original value and test one option at a time. If the application offers a lower-memory mode, smaller texture setting, reduced batch size, or project optimization option, use the documented control rather than an unofficial patch.
Next, inspect system conditions. Check GPU temperature, power behavior, system memory pressure, storage availability, and background processes. A system can appear to have a VRAM problem when the actual cause is a driver reset, overheating, unstable overclock, insufficient system RAM, or a damaged application cache. Restore factory GPU clocks if the card is overclocked and test stability before making further changes.
If the problem persists, collect logs and reproduce it with the smallest possible workload. Compare a new project or clean game profile with the original one. If the clean workload works, the issue may relate to a particular asset, configuration, plugin, or save. If all workloads fail, investigate the driver, operating system, and hardware more broadly. Use official support channels for driver cleanup or firmware procedures.
What not to do
Do not download unknown executables advertised as VRAM expanders, memory cleaners, or guaranteed stutter fixes. Software cannot increase the physical dedicated memory installed on a discrete GPU. Avoid registry edits copied without a clear explanation, disabling security services, or flashing unofficial firmware. These steps can destabilize a system and make diagnosis harder.
Do not assume that a higher memory allocation is itself a fault. Some applications reserve memory for caching. Do not publish a benchmark claim from a single run or infer a hardware defect from one crash. Verify the issue, preserve logs, and distinguish observed facts from possible explanations.
Frequently asked questions
Can Task Manager show VRAM usage?
Yes. Windows Task Manager can show dedicated and shared GPU memory, though available details depend on the Windows version and driver.
Is an overlay accurate?
It can be useful, but tools differ in the metric and sampling interval. Check the documentation and compare repeatable measurements.
Should I monitor VRAM or GPU utilization?
Both can help. Also monitor temperature, clocks, CPU use, system RAM, and frame times when diagnosing performance.
Why does VRAM usage change between runs?
Caching, asset streaming, background processes, scene variation, and application behavior can change allocation.
Does monitoring reduce FPS?
A lightweight overlay usually has limited impact, but capture tools and excessive overlays can add overhead. Test with them disabled if results seem unusual.
Conclusion
Monitor memory together with frame times and system behavior. The goal is to identify a repeatable bottleneck, not to keep the VRAM number as low as possible.
A methodical approach is safer and more effective than applying a collection of unrelated tweaks. Identify the symptom, capture the configuration, change one variable at a time, and confirm that the result is repeatable. If the issue appears to be hardware-related or involves repeated driver resets, use manufacturer diagnostics or qualified repair support rather than risking the system with undocumented fixes.