Does VRAM Affect 1% Low FPS? Understanding Frame-Time Spikes
Introduction
Players often notice inconsistent smoothness before they notice a large change in average frame rate. A game may report a respectable average FPS while producing occasional long frames that feel like a hitch. This is why 1% low FPS and frame-time analysis are useful in GPU reviews. VRAM capacity can contribute to poor low-percentile performance when a workload exceeds the graphics card's practical memory budget, but it is only one of several possible causes.
This guide is designed to answer the practical question behind the headline, explain the technical principles involved, and give readers a repeatable way to evaluate their own hardware. Graphics memory is often discussed as if it were a single performance number, but real workloads are more complicated. The amount of memory installed, the amount currently allocated, the amount actively needed, the speed of the memory subsystem, and the work performed by the GPU core are related but distinct factors.
A useful analysis starts by identifying the workload. A game, an AI model, a 3D scene, and a video-editing timeline can use the same graphics card in very different ways. Each application creates its own resource footprint and responds differently when memory becomes constrained. The same capacity can be comfortable in one task and limiting in another. For that reason, this article avoids universal claims and explains which variables should be checked before making a decision.
| Possible cause of frame-time spikes | VRAM-related? |
|---|---|
| Working set exceeds the practical VRAM budget | Yes — memory pressure can contribute to poor low-percentile performance |
| Shader compilation | No |
| CPU bottleneck | No |
| Storage latency | No |
| Thermal throttling, driver overhead, background tasks, or game bugs | No |
Quick answer
Use low-percentile FPS as one part of a broader performance picture. A frame-time trace and controlled tests are essential before blaming VRAM.
The central rule is to measure the workload you actually run, not to assume that a specification or monitoring number tells the whole story. Where possible, compare equivalent settings, record repeatable measurements, and separate capacity limits from compute, bandwidth, CPU, storage, and software limitations.
Average FPS and frame time are different views
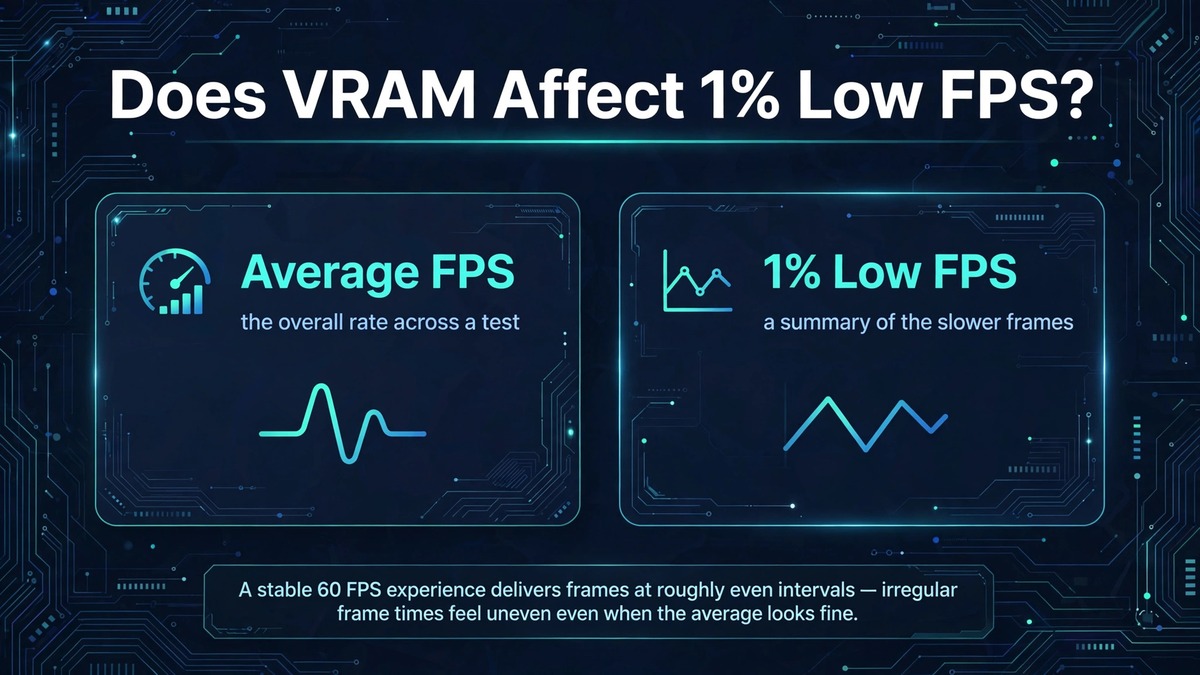
Average FPS summarizes how many frames are delivered over a test interval. Frame time measures how long each individual frame takes to complete. A stable 60 FPS experience ideally delivers frames at roughly even intervals, while irregular frame times can feel uneven even when the average looks acceptable. A low-percentile metric summarizes slower frames, but the calculation method should always be disclosed.
How memory pressure can create hitches
Games load and stream resources as the player moves through the world. If the resources needed for a scene do not fit comfortably in local VRAM, the engine and driver may need to move data, evict resources, or fetch assets again. Depending on the system, this can contribute to delays. The effect is engine-specific and should not be described as an inevitable result of reaching a particular allocation percentage.
Other causes of frame-time spikes
Shader compilation, CPU bottlenecks, background tasks, storage latency, thermal throttling, driver overhead, network activity, and game bugs can all produce stutter. A CPU-limited game may show poor low-percentile results even when VRAM use is modest. A storage-related hitch can occur as new assets load. Diagnosis requires monitoring several system metrics at the same time.
A controlled test method
Choose a repeatable route and record the same section several times. Use the same game version, driver, system configuration, and graphics settings. Capture a frame-time trace, average FPS, low-percentile FPS, GPU utilization, CPU utilization, system RAM, and VRAM allocation. Then reduce only texture quality or another suspected memory-heavy setting and repeat the test. Look for a repeatable change rather than a single lucky run.
Why 1% low figures need context
Different tools and reviewers may calculate 1% lows differently. Some report the average of the slowest one percent of frames, while others use percentile frame-time conversions or different capture windows. Test duration and scene selection can change the result. For transparent reporting, identify the tool, version, capture duration, calculation method, and whether loading screens were excluded.
How to improve consistency
Update the game and graphics driver when a relevant fix is available, close unnecessary GPU-accelerated applications, and reduce settings that create a repeatable bottleneck. Allow shader compilation to finish when the game uses a shader cache. Check temperatures and power behavior. Avoid blindly applying registry tweaks or memory-cleaner utilities that promise to eliminate stutter without identifying its cause.
A practical evaluation workflow
Start by documenting the exact hardware and software configuration. Record the GPU model, installed memory capacity, driver version, operating system, application version, CPU, system memory, and storage device. In a laptop or compact system, also note power mode and thermal conditions because those can change sustained performance. For a game, write down resolution, texture quality, ray tracing, upscaling, frame generation, and the exact scene or benchmark route. For an AI workflow, record model name, quantization, context length, batch size, framework, and whether layers are offloaded to CPU.
Next, establish a baseline. Close unnecessary applications, allow the workload to reach a steady state, and repeat the same task several times. Record average performance as well as low-percentile behavior or completion time. Capture memory allocation and system RAM use, but do not interpret either number alone. If the application exposes logs, save them. A screenshot is useful for documenting settings, while a CSV or frame-time trace is better for later comparison.
Change one variable at a time. If you change resolution, texture quality, batch size, model quantization, and driver version together, it becomes impossible to know which change produced the result. A controlled test can reveal whether a setting affects memory capacity, compute load, bandwidth, or simply image quality. Repeat the test after each change and note any visual or functional differences.
Finally, report the limitations. State whether the result came from a built-in benchmark, a repeatable manual route, a synthetic test, or a single real project. Explain whether the test was repeated and whether the measurement tool reports allocated, reserved, or actively used memory. Honest methodology makes an article more useful than a confident headline supported by an unexplained number.
Common mistakes and misleading conclusions
One common mistake is treating memory allocation as proof of memory exhaustion. Applications may reserve unused capacity for caching, and monitoring utilities do not all report the same metric. Another mistake is assuming that more capacity automatically increases performance. Extra memory helps when the workload needs it; it does not make shader cores faster or increase the speed of a narrow memory bus.
A third mistake is comparing different graphics cards as though memory capacity were the only difference. GPU architecture, core count, memory bandwidth, power limits, cooling, and driver maturity can all affect results. If two products differ in several ways, describe the comparison as a product-level test rather than a controlled memory-capacity experiment.
It is also easy to overlook software versions. Game patches can change asset streaming, shader compilation, and graphics settings. AI frameworks can change memory allocation strategies between releases. A result should therefore include a date and version information, and older findings should be retested before being presented as current advice.
Frequently asked questions
Can low VRAM reduce 1% lows?
Yes, memory pressure can contribute to inconsistent frame delivery, but CPU, storage, shader compilation, and driver issues can also cause poor lows.
Does high VRAM allocation prove a bottleneck?
No. Games may reserve memory for caching. Look for repeatable symptoms and controlled setting changes.
What is a good frame-time graph?
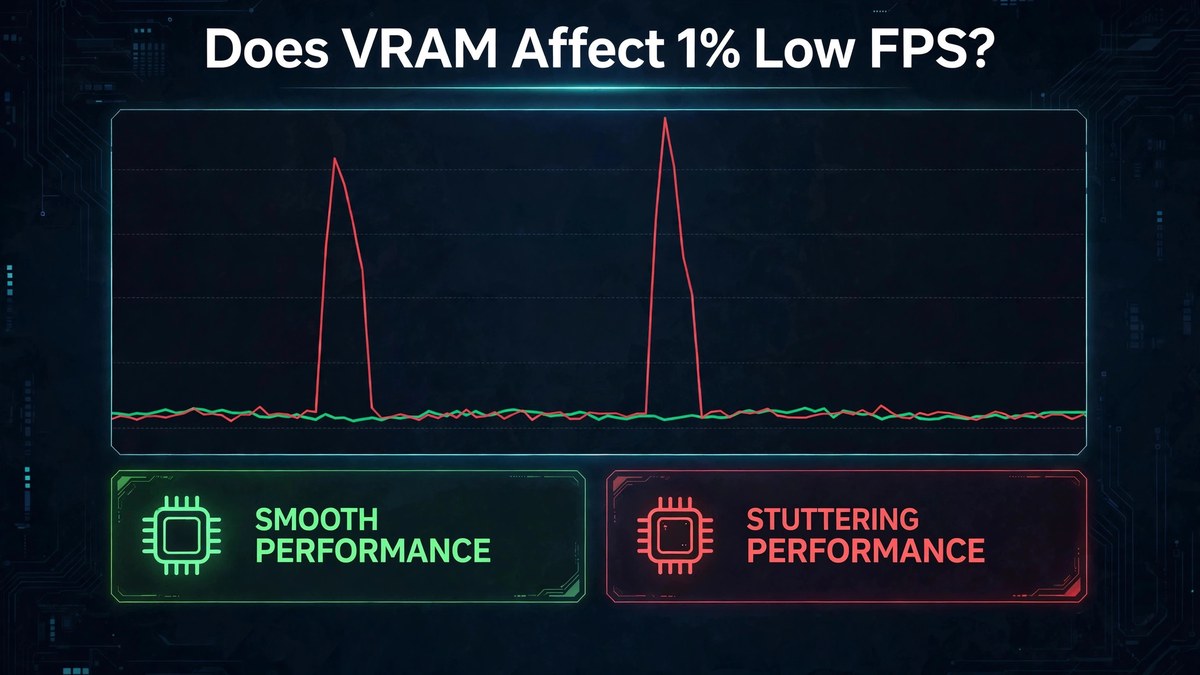
A stable graph has relatively consistent frame durations. Large spikes indicate frames that took longer, but the cause needs further investigation.
Should benchmarks report 1% lows?
They can be useful when the method is clearly defined and tests are repeatable. Frame-time traces add important context.
Will lowering textures always fix stutter?
No. It may help if memory pressure is the cause, but it will not solve CPU, storage, shader, or network-related problems.
Conclusion
Use low-percentile FPS as one part of a broader performance picture. A frame-time trace and controlled tests are essential before blaming VRAM.
The most reliable decision comes from matching the hardware to a clearly defined workload and validating it with repeatable evidence. Use specifications to narrow the options, use measurements to understand actual behavior, and explain the limits of every comparison. That approach helps readers make a better decision without confusing a single memory figure with total graphics performance.